The whole workload, not one query
An index that speeds up one query can slow ten others. Every change set is costed against all of your top query patterns at once, weighted by how often each runs.
QueryInsights finds the queries costing your database the most time, then tests index changes on a workload twin: an empty copy of your schema loaded with production's statistics. Your database's own optimizer costs the whole workload. You only see changes that make it faster with no query getting slower.
Works with PostgreSQL, MySQL, CockroachDB, and Trino. No proxy, no SDK, nothing installed on production.
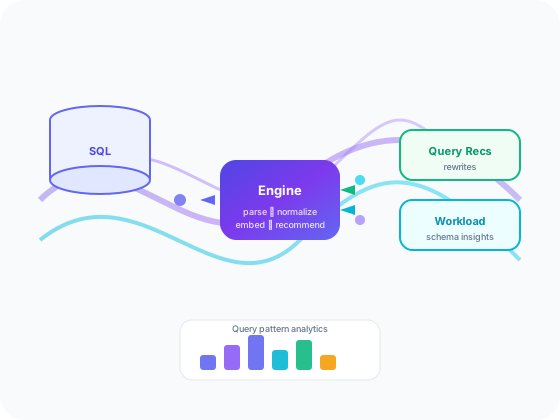
Query optimization shouldn't mean staring at execution plans for hours. QueryInsights does the slow-query analysis for you and hands back the fix.
Your database is slow.
You know it. But you don't know which query, on which table, in which pattern — and dashboards full of metrics don't tell you what to actually change.
Slow queries hide in noise.
The same query runs a thousand ways. Without normalization you can't tell which patterns truly drive load, so slow-query analysis turns into endless log scrolling.
Every index is a gamble.
An index that fixes one query can slow down writes and change the plans of queries you never looked at. Without testing it against the whole workload, you find out in production.
The costliest queries land on your screen, with a fix that has already been tested against everything else.
Finding slow queries is the easy part. Knowing which schema change makes the whole workload faster, without making something else slower, is the hard part. QueryInsights answers it on an empty copy of your database that plans queries exactly like production does.
Swipe to see the whole diagram →
An index that speeds up one query can slow ten others. Every change set is costed against all of your top query patterns at once, weighted by how often each runs.
Numbers come from EXPLAIN on a twin that has production's sizes and statistics. The AI explores ideas; the optimizer measures them. Nothing it says is taken on trust.
Production only sees read-only catalog queries. Hypothetical indexes, experiments and the agent all live on a separate twin server with no rows in it.
We applied one proven change set to a benchmark database and ran the same load before and after. Every query the twin said would improve did. The two it said would not change, didn't.
| Query | Twin predicted (planner cost) | Production measured (mean time) | Faster | ||
|---|---|---|---|---|---|
| Events for a user, newest first | 36,416.8 | 4.5 | 118.3 ms | 0.073 ms | 1,621× |
| Orders for a user | 22,743.7 | 89.9 | 73.6 ms | 0.052 ms | 1,415× |
| Pending orders, newest first | 41,412 | 5,420.4 | 50.8 ms | 0.022 ms | 2,309× |
| Users by country and plan | 4,870 | 2,196.4 | 33.3 ms | 2.3 ms | 14× |
| Order by id (already indexed) | 8.2 | unchanged | 0.089 ms | 0.020 ms | no change predicted |
| Update order status | 8.2 | unchanged | 0.13 ms | 0.063 ms | no change predicted |
Every number here comes from a benchmark that ships with QueryInsights. No projections, no averages from unnamed customers.
20/20
Query plans on the empty twin matched production for 20 of 20 test queries, with cost within 10%, on PostgreSQL 16 and 18.
174×
Average latency of the benchmark workload fell from 176 ms to 1.01 ms after applying the change set the twin proved.
0
A change set is only shown as proven when no query in the top-N workload gets a more expensive plan.
0
The twin holds schema and statistics only. Production sees read-only catalog queries, never an experiment.
Measured on a reproducible benchmark (seeded PostgreSQL 16, pgbench, same load before and after). Your results depend on schema, data and workload.
QueryInsights closes the loop between “something is slow” and “here is exactly what to change” — automatically, for every pattern in your workload.
Reads the statistics PostgreSQL, MySQL and CockroachDB already keep for every query, and Trino's query events. Each execution counts once. No proxy in front of your traffic, no SDK in your application.
Thousands of queries collapse into a handful of patterns by replacing literals with placeholders. You see what's truly heavy — not duplicates dressed up as different queries.
Every slow query pattern gets a focused AI query-optimization review grounded in your real table definitions — predicate ordering, join shape, engine-specific gotchas, written so an engineer can ship it.
Candidate indexes are tested on an empty copy of your schema with production's statistics. Your database's own optimizer costs the whole top-N workload, and any change that slows a query is rejected.
Patterns are ranked by total execution time, calls and rows read from your database's own counters. Traffic you can't change, like a Spark job, can be ignored or kept for schema advice only.
Indexes that no query reads, and indexes another index already covers, are found straight from the catalog with no AI involved. Each comes with the DROP statement and a caution about when usage counters reset.
QueryInsights sits beside your database, learns from the queries that actually run, and only recommends changes it has tested against your real workload.
Read the statistics your database already keeps for every query: executions, total time, rows read. QueryInsights records the change on each poll, so every execution counts once. Nothing sits in your traffic path.
Queries collapse into patterns with their literals removed, ranked by total database time. Noise you don't control, like a Spark job or BI tool, can be ignored with a rule.
Candidate index changes are tested on a workload twin with production's statistics. The optimizer costs your whole top-N workload, and any change that slows a query is rejected.
Get the proven change set with every affected query's plan before and after, plus AI rewrites for individual slow queries, grounded in your real schema.
QueryInsights is a side-car for your databases — it observes, learns, and serves up advice. Nothing in the request path. Nothing for your application to integrate.
Alongside workload-wide index changes, every top query pattern gets its own AI review, grounded in your real schema.
SELECT *
FROM orders o
JOIN line_items l ON l.order_id = o.id
WHERE o.created_at > ?
ORDER BY o.id
LIMIT ?
Wide SELECT *, late filter, unbounded top-N sort over a join on a hot table.
SELECT o.id, o.created_at, l.sku, l.qty
FROM orders o
JOIN line_items l ON l.order_id = o.id
WHERE o.created_at > ?
  AND o.id > ?    -- keyset pagination
ORDER BY o.id
LIMIT ?What QueryInsights does, which databases it supports, and how it finds and fixes slow queries.
QueryInsights is a SQL performance and query optimization tool. It ranks your query patterns by the database time they cost, then proves index changes on a workload twin — an empty copy of your schema with production's statistics — so you only ship changes that make the whole workload faster and no query slower.
QueryInsights captures and analyzes workloads from PostgreSQL, MySQL, CockroachDB and Trino. Proven workload advice on a twin is available for PostgreSQL 16 and newer today; CockroachDB and MySQL twins have been validated and are next.
A SQL query is usually slow because it scans more data than it needs, filters too late, joins inefficiently, or is missing an index. QueryInsights acts as a query profiler and database advisor: it pinpoints which of your query patterns are slow and why, then recommends the specific change to fix it — instead of leaving you to guess from a query plan.
It reads each database's own statement statistics, where every normalized query already carries its execution count, total time and rows read. QueryInsights records the change in those counters on every poll, so each execution is counted once, and ranks patterns by total database time. You see the handful of patterns that account for most of your load.
Speeding up a slow query usually means scanning less data, filtering earlier, fixing the join or projection, or adding the right index. QueryInsights does this analysis for you: it captures the query that's taking too long, grounds an AI review in your real schema, and returns a ready-to-ship rewrite plus any index that improves query response time.
Two complementary kinds. Per-query rewrites show how a specific slow query can be written better — predicate ordering, join shape, projection scope, and engine-specific tuning. Workload-level advice recommends a set of index changes for your whole workload, and on PostgreSQL that set is proven on a workload twin before you see it.
An empty copy of your database schema whose query planner is loaded with production's table sizes, column statistics and planner settings. Because it holds no data, QueryInsights can try index changes on it instantly and ask the database's own optimizer what every top query would cost. In our benchmark the twin's plans matched production for 20 of 20 queries.
Every candidate change set is re-costed against all of your top query patterns at once, weighted by how often each runs. A change set is only marked proven when it lowers total cost, no query gets a more expensive plan, and every new index is used by at least one query. You can open each query's plan before and after.
Only with read-only catalog queries that read schema, statistics and planner settings. No rows are copied, nothing is installed on production, and every experiment runs on the separate twin server that QueryInsights manages.
No — it complements them. EXPLAIN and execution plans tell you how one query runs right now; QueryInsights tells you which queries across your whole workload are worth optimizing and hands you a concrete fix, grounded in your real schema, so you spend less time reading query plans by hand.
Often, indirectly. Slow queries burn CPU, scan extra data, and tie up resources. On cloud and managed databases where you pay for query compute or scanned data, optimizing your heaviest query patterns lowers database resource usage and can reduce compute costs. QueryInsights ranks patterns by impact so you cut the most expensive ones first.
Two non-invasive paths: pollers that read the statistics views PostgreSQL, MySQL and CockroachDB already keep (pg_stat_statements, performance_schema, statement_statistics), and a webhook for Trino query events. There is no proxy in front of your traffic and no SDK in your application.
No. QueryInsights observes your database performance from the side. There are no driver changes, no SDKs, and no code changes required to start getting slow-query analysis and optimization recommendations.
QueryInsights is in early access. Reach out to be notified when it opens up more broadly and to get help connecting your PostgreSQL, MySQL, CockroachDB or Trino workload.
QueryInsights is in early access. Tell us a little about your workload and we'll be in touch.
Or email us at bhargav.akhani@queryinsights.dev